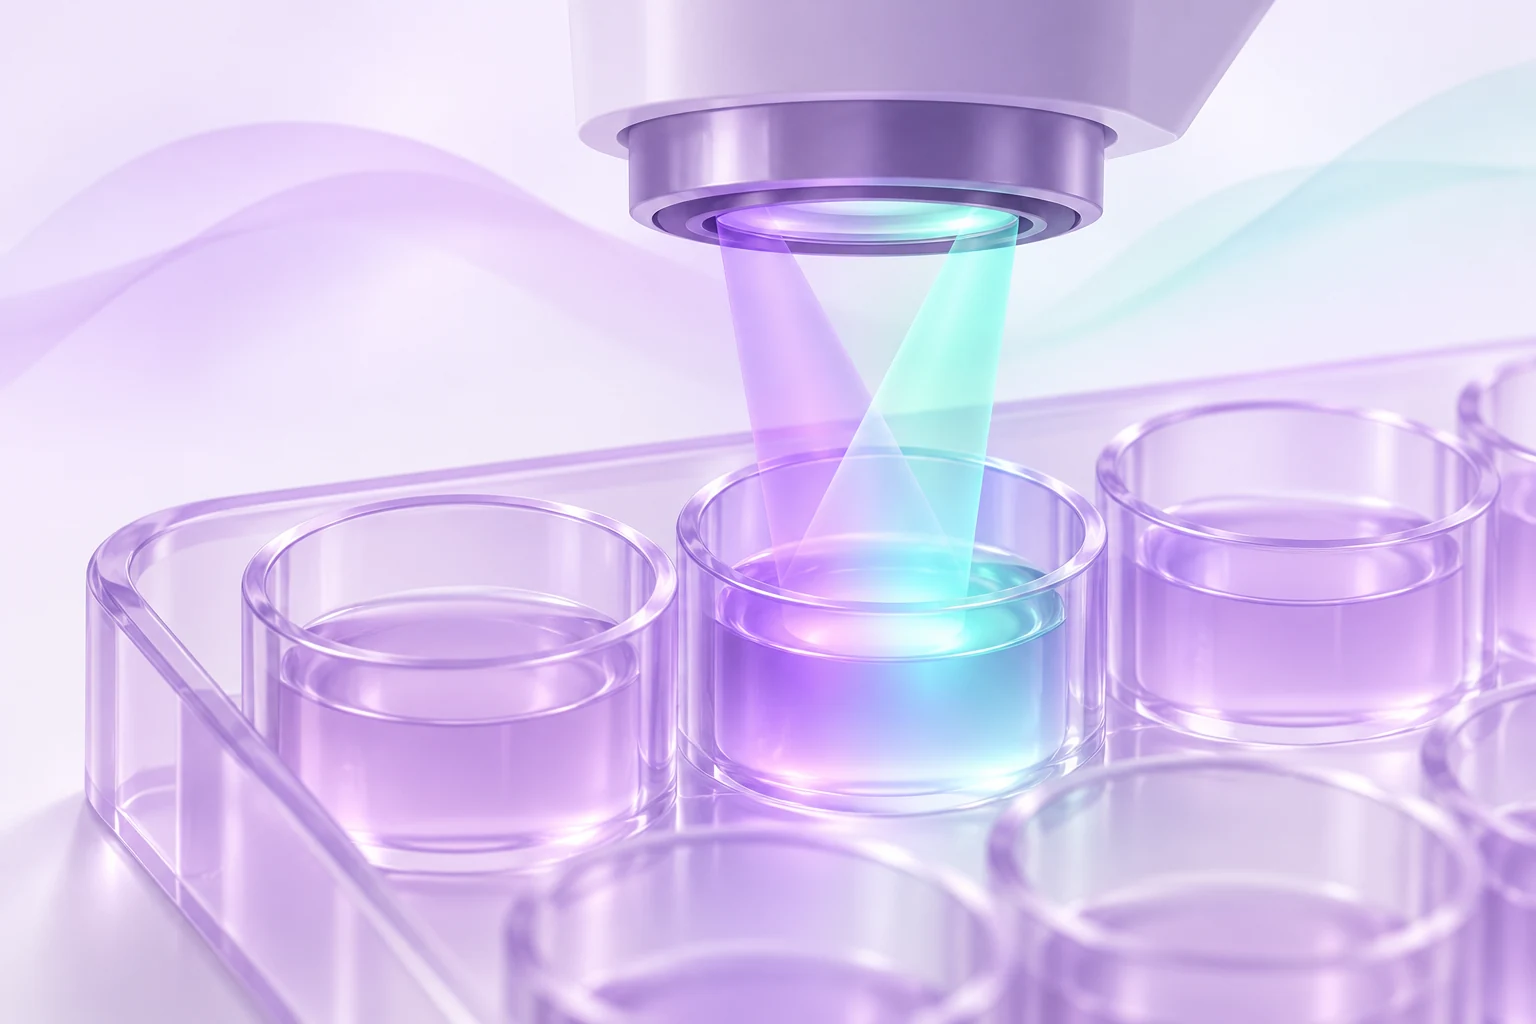
The well lights up. What happened?
Imagine opening a peptide paper and finding a tidy curve: more test material, more fluorescence. The authors call it increased activity. It is an appealing figure, especially when the points sit neatly along the fitted line. But put a finger over the conclusion for a moment. What did the instrument actually detect?
This is a hypothetical example, not a result for any particular peptide. Its useful question is whether the experiment separates the biological event from the light used to report it. Follow that distinction through the methods and a bright well becomes much more interesting than a single “active” label.
Extra light and missing light can both mislead
Fluorescence detection uses excitation light and measures emitted light. A test substance can contribute its own emission in the detection window: autofluorescence. It can also diminish the measured signal. One route is the inner filter effect, where absorption intercepts incoming excitation light or outgoing emission. The NIH/NCATS optical-interference chapter discusses this attenuation alongside quenching.
Whether that makes a sample look active or inactive depends on the assay’s design. Some experiments look for increasing fluorescence; others look for a decrease. Interference can also vary with concentration, so an orderly concentration-response curve does not settle the issue. The question is what produced the curve, not how attractive the fit looks.
A real experiment measured the compounds themselves
In 2008, Anton Simeonov and colleagues measured fluorescence from more than 70,000 compound-library samples across detection regions used in screening. They tested concentration series against fluorophore standards. The experiment asked how much light the samples themselves contributed, without treating that light as a biological response.
More than 5% of library members exceeded the fluorescence equivalent of a specified ultraviolet-active reference, 10 nM 4-methylumbelliferone. Moving toward longer wavelengths substantially reduced autofluorescence in that library. These findings describe the tested collection and conditions. They do not estimate the fraction of peptides that interfere or establish the optical behavior of semaglutide, LL-37 or any EliteGen lot.
The revealing control may happen after the reaction
The Protease Assays chapter describes a particularly clear way to separate detection from enzyme activity. In a fluorescence-based enzyme assay, researchers can examine a stopped reaction and add the test compound afterward. The enzymatic result is already there; the comparison now asks whether the compound changes the measured fluorescence. Extra light or a loss of light points to a detection effect under those conditions.
As a reader, notice exactly what this control preserves and what it changes. A blank well is useful, but it does not automatically reproduce the fluorescent reaction product, the surrounding mixture or the test material’s interaction with them. A control earns its place by addressing a specific alternative explanation.
The same chapter cautions that chromatography can have detection problems too, including overlapping compound and product peaks. A different instrument deserves the same careful reading of its controls.
Fuentes: Guofeng Zhang, NIH/NCATS Assay Guidance Manual (2012): Protease Assays
A microscope does not make the problem disappear
Images provide location and shape, which a whole-well intensity number cannot show. Still, the 2025 NIH/NCATS chapter on high-content screening describes optical contributions from cells, culture media, test compounds and other materials. Background fluorescence can overlap the signal from the intended reporter. An image can be sharp and still leave the origin of its light unresolved.
The chapter recommends examining unstained, untreated controls in the relevant imaging channels when assessing endogenous background. It also discusses reviewing images when measurements flag possible interference. When reading a figure, look for the comparison images as well as the selected examples. Ask whether the apparent change is confined to the expected region, whether the background changed, and whether comparable acquisition and display settings were used.
Ask the biological question a different way
A counterscreen tests an alternative explanation, such as interference with detection. An orthogonal assay seeks evidence for the biological activity using an independent detection approach. Auld and Inglese explain why the distinction matters: a clean counterscreen does not itself demonstrate the activity that interested the researchers.
Agreement across appropriately matched methods strengthens the interpretation, but it does not prove the proposed molecular mechanism. Disagreement calls for a closer look at what the methods actually measure and which experimental conditions differ. The most useful comparison changes the detection principle while keeping the biological question closely aligned.
Even switching to a light-producing luciferase reporter brings its own checks: compounds can affect the reporter enzyme. “We used a second assay” is therefore the start of the explanation. Read what that second assay contributes.
Three notes to make beside the next figure
Try leaving yourself three short notes instead of immediately accepting or rejecting the paper. The first names the observation: which channel, which direction of change, which comparison. The second identifies the strongest control shown. The third states the question you would still want answered.
For our fictional bright-well figure, your notes might read: “Fluorescence increased with test concentration. A detection control is shown beside the main experiment. I need to understand whether the independent assay asks the same biological question.” That is a more useful starting point for discussion than deciding that every bright sample is active or that every fluorescent compound is worthless.
Keep the conclusion as specific as the evidence. The goal is to understand why the authors believe the biological interpretation survives the checks, and where their experiment leaves room for another explanation.
Preguntas frecuentes
Can a concentration-response curve be caused by fluorescence interference?
Yes. Optical interference can vary with concentration. A smooth curve therefore needs controls that address detection effects before its shape is assigned to biological activity.
Does moving to a redder fluorescence channel solve the problem?
It reduced autofluorescence in Simeonov and colleagues’ tested compound library. That finding supports considering the measurement window; it does not guarantee that a different sample and assay will be free of interference.
Does an interfering compound have no biological activity?
Interference and biological activity can coexist. The useful next evidence comes from a suitable independent measurement that can evaluate the activity despite the detection problem.
Fuentes
- Interference with Fluorescence and AbsorbanceSimeonov and Davis, NIH/NCATS Assay Guidance Manual · 2018
- Fluorescence Spectroscopic Profiling of Compound LibrariesSimeonov and colleagues, Journal of Medicinal Chemistry · 2008 · DOI: 10.1021/jm701301m
- Protease AssaysGuofeng Zhang, NIH/NCATS Assay Guidance Manual · 2012
- Interference and Artifacts in High-content ScreeningDahlin and colleagues, NIH/NCATS Assay Guidance Manual · 2025
- Interferences with Luciferase Reporter EnzymesAuld and Inglese, NIH/NCATS Assay Guidance Manual · 2018
EliteGen Research publica este artículo con fines educativos para la investigación. Los estudios describen sus propios materiales y condiciones experimentales. No determinan la identidad, la calidad ni la idoneidad de un producto de EliteGen. Este artículo no ofrece orientación para uso personal, humano ni veterinario.