A small change can move the entire ratio
Start with a made-up pair of measurements. A sample contains 1,000 units of reduced glutathione and five units of glutathione disulfide. The ratio is 200 to one. If ten units of the reduced form convert into five units of the disulfide while the sample is being handled, the readings become 990 and ten. The first number barely moves. The ratio falls to 99 to one.
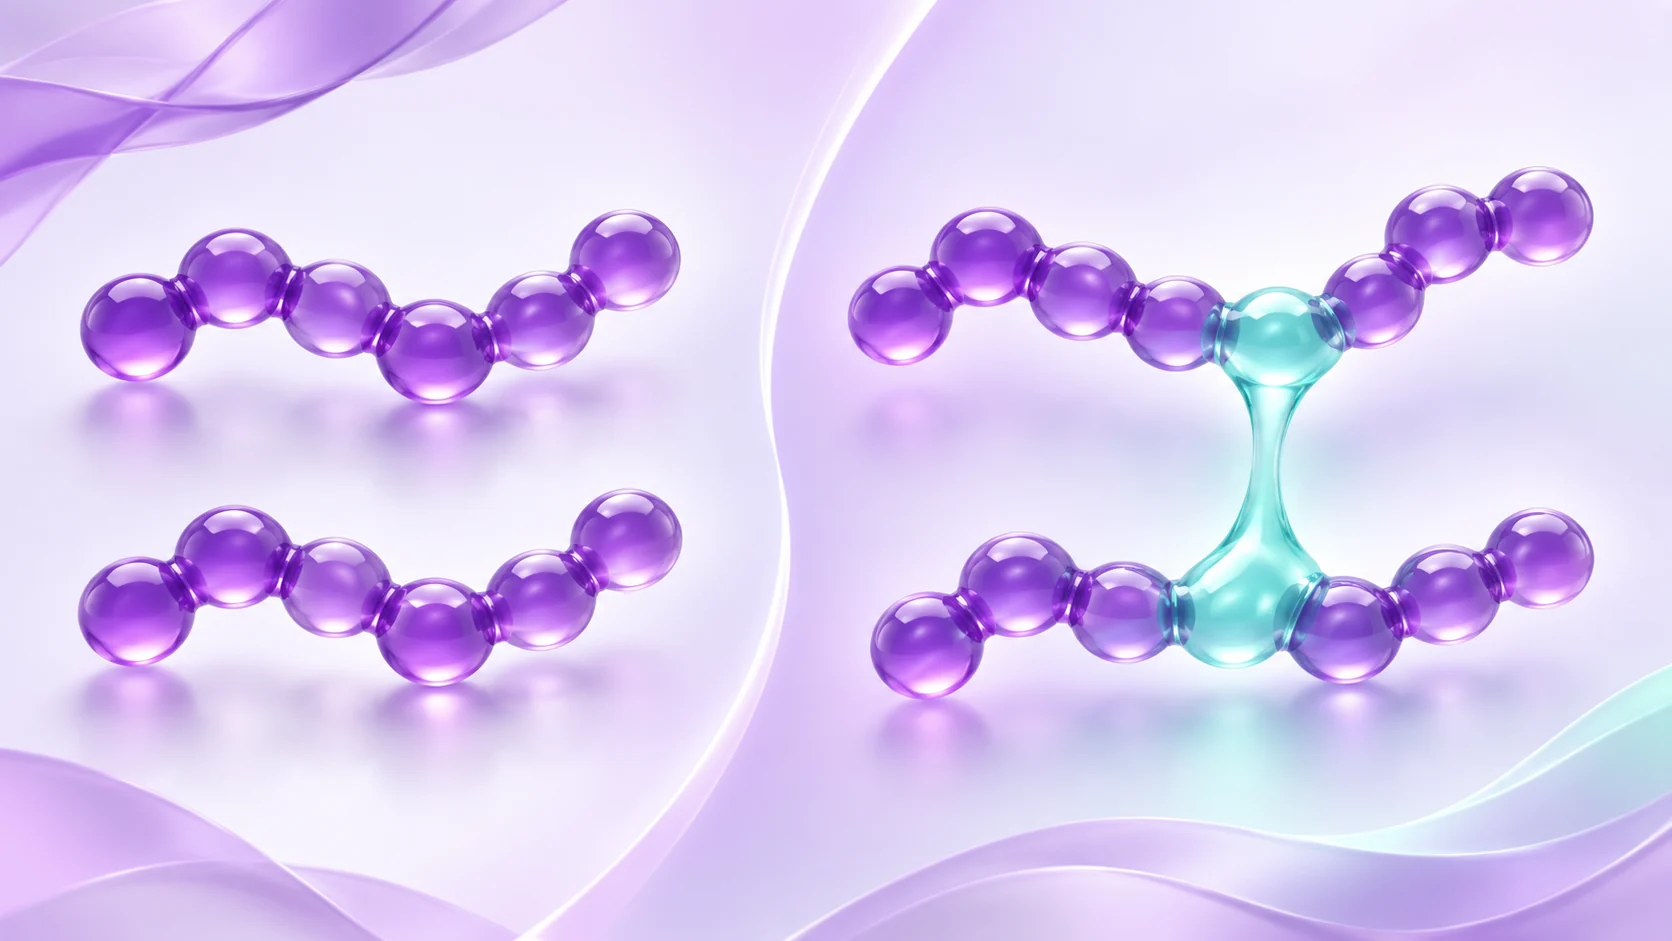
That arithmetic is the reason a redox figure deserves a close look at the methods. GSH is the reduced form of glutathione, a three-residue peptide. GSSG, glutathione disulfide, contains two glutathione units joined by a bond between their sulfur atoms. When GSSG is the smaller number, a little conversion after collection can have an outsized influence on the ratio. The numbers above illustrate the arithmetic. The analytical papers below show how researchers established that conversion really happened in their samples.
Notice what stays constant in the example. If you count each disulfide as two glutathione units, the total is 1,010 units both times. A total alone would miss the change in the distribution between forms. Read a table labelled total glutathione with its definition in view and check whether the two forms were reported separately.
A result that changed when the sample preparation changed
In 2002, Ranieri Rossi and colleagues looked at why different papers reported such different amounts of glutathione disulfide in blood. Their experiments compared analytical conditions and included both a spectrophotometric measurement and a chromatographic approach. They found that oxidation during a step that removed proteins could create GSSG in the sample, and linked that effect to oxygenated hemoglobin in the preparations they examined.
The arterial and venous rat blood comparison in Table 4 makes the issue easy to see. The reported average GSSG concentrations without pretreatment were 75 and 31.2 micromoles per litre, respectively. In the comparison where the authors used a treatment to limit conversion, the averages were 5.6 and 6.6. The gap between the sample types shrank and its direction changed. Those values belong to the rat experiment in that table. The treated rows report no separate GSH result, so they cannot supply a paired GSH/GSSG ratio for that comparison.
When a result changes that much with the preparation, the method is part of the explanation. Before using the untreated difference to tell a story about arterial and venous blood, look at what happens when the comparison accounts for the conversion during handling.
A heavier label helped researchers trace new disulfide
Julia Reinbold and colleagues took a different approach in a study of red blood cells published in 2014. They used stable isotope labels to make analytical standards distinguishable by mass. One mixed disulfide they observed contained a labelled glutathione unit from the standard and an unlabelled unit from the sample. The label gave them evidence that this disulfide formed after the two were brought together during analysis.
The authors used the mixed signal to estimate how much of the detected GSSG had formed during the process. After correction, GSSG amounted to less than half a percent of the GSH concentration in their tested preparations. That percentage describes what the authors estimated for those samples. A different sample type or analytical method needs its own evidence about the amount of conversion.
The clever part is that the suspected artifact had its own measurable signal. Two methods might report different numbers for all sorts of reasons. Here the researchers could follow the label into a product that could only form after the standard was introduced.
Check the sample and the units before you compare
Start with the sample name. Whole blood contains blood cells, plasma is the liquid fraction, and a red blood cell preparation focuses on one cell type. A ratio from one belongs with that sample. Record the two concentrations as well as the direction of the division, since some authors report GSH/GSSG and others report the inverse.
Watch for a second distinction in the figure label. A ratio and an estimated redox potential are different quantities. Jones and colleagues measured thiol and disulfide forms in plasma and used a thermodynamic equation to calculate potentials. For the glutathione pair, that calculation uses a squared term for reduced glutathione because two reduced molecules correspond to one disulfide. Two samples can share the same simple ratio and have different absolute concentrations, so the ratio alone gives an incomplete account of that calculation.
Ask which observation supports the comparison
When two papers report different ratios, try tracing each value backwards. Can you recover both underlying measurements? Does either paper show how much conversion occurred during analysis, or use a comparison that tests for it? Find out whether the smaller number could be measured reliably at the levels reported. When a denominator is too small for the method to quantify, substituting zero would turn a measurement limit into a very different claim.
A useful reading note records the sample, the two forms of glutathione, the direction of the ratio and the evidence about conversion during analysis. Those details make it possible to decide whether the numbers actually answer the same question.
Frequently asked questions
What does a lower GSH/GSSG ratio mean in an assay?
It means there is less measured GSH per unit of measured GSSG. Inspect both underlying concentrations and any evidence of sample conversion before assigning that difference to the original biological material.
Sources: Rossi and colleagues, Clinical Chemistry (2002): Blood glutathione disulfide: in vivo factor or in vitro artifact? · Reinbold, Koehler and Rychlik, Analytical Biochemistry (2014): Quantitation of glutathione and its oxidation products in erythrocytes by multiple-label stable-isotope dilution
How can the instrument accurately detect a misleading amount of GSSG?
If GSSG forms before the measurement, the instrument can detect molecules that are really present at that point. A handling comparison or a distinguishable label can help establish when some of that material formed.
Sources: Rossi and colleagues, Clinical Chemistry (2002): Blood glutathione disulfide: in vivo factor or in vitro artifact? · Reinbold, Koehler and Rychlik, Analytical Biochemistry (2014): Quantitation of glutathione and its oxidation products in erythrocytes by multiple-label stable-isotope dilution
Can I compare a plasma ratio with one from red blood cells?
Report the sample type with each value. The two preparations represent different parts of the blood sample and may have different analytical constraints. Compare them as distinct measurements and look for validation in each sample type.
Sources: Reinbold, Koehler and Rychlik, Analytical Biochemistry (2014): Quantitation of glutathione and its oxidation products in erythrocytes by multiple-label stable-isotope dilution · Jones and colleagues, Free Radical Biology and Medicine (2000): Redox state of glutathione in human plasma
Sources
- Blood glutathione disulfide: in vivo factor or in vitro artifact?Rossi and colleagues, Clinical Chemistry · 2002 · DOI: 10.1093/clinchem/48.5.742
- Quantitation of glutathione and its oxidation products in erythrocytes by multiple-label stable-isotope dilutionReinbold, Koehler and Rychlik, Analytical Biochemistry · 2014 · DOI: 10.1016/j.ab.2013.09.029
- Redox state of glutathione in human plasmaJones and colleagues, Free Radical Biology and Medicine · 2000 · DOI: 10.1016/s0891-5849(99)00275-0
Published by EliteGen Research for research education. Studies describe their own materials and experimental conditions; they do not establish the identity, quality, or suitability of an EliteGen product. This article does not provide guidance for personal, human, or veterinary use.