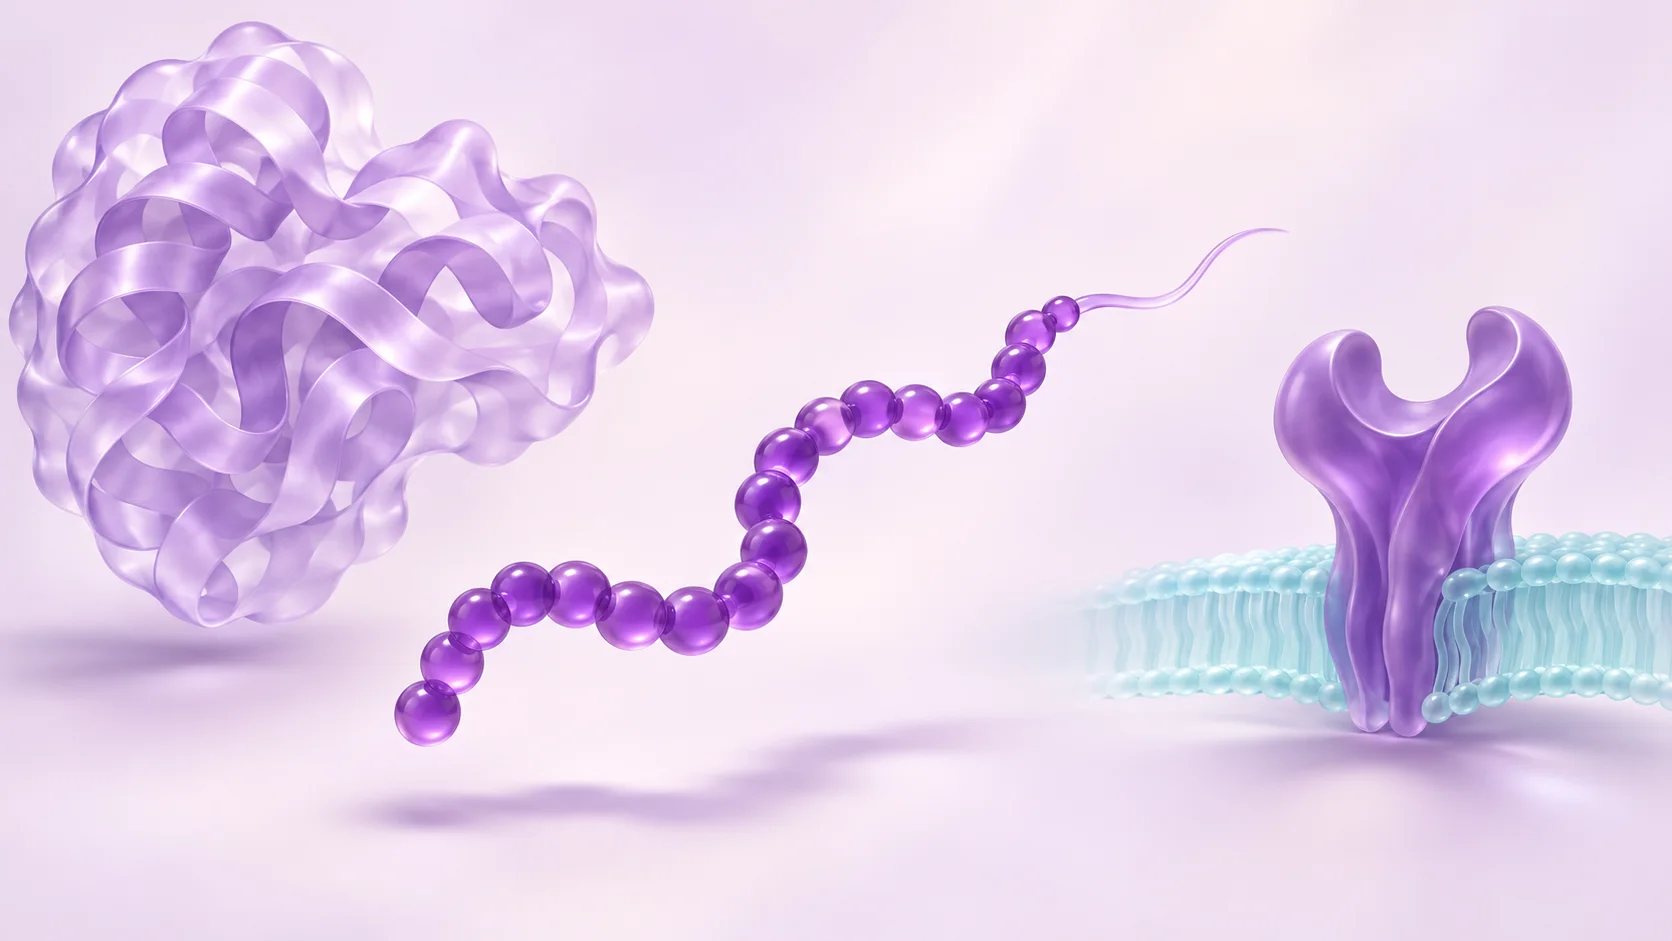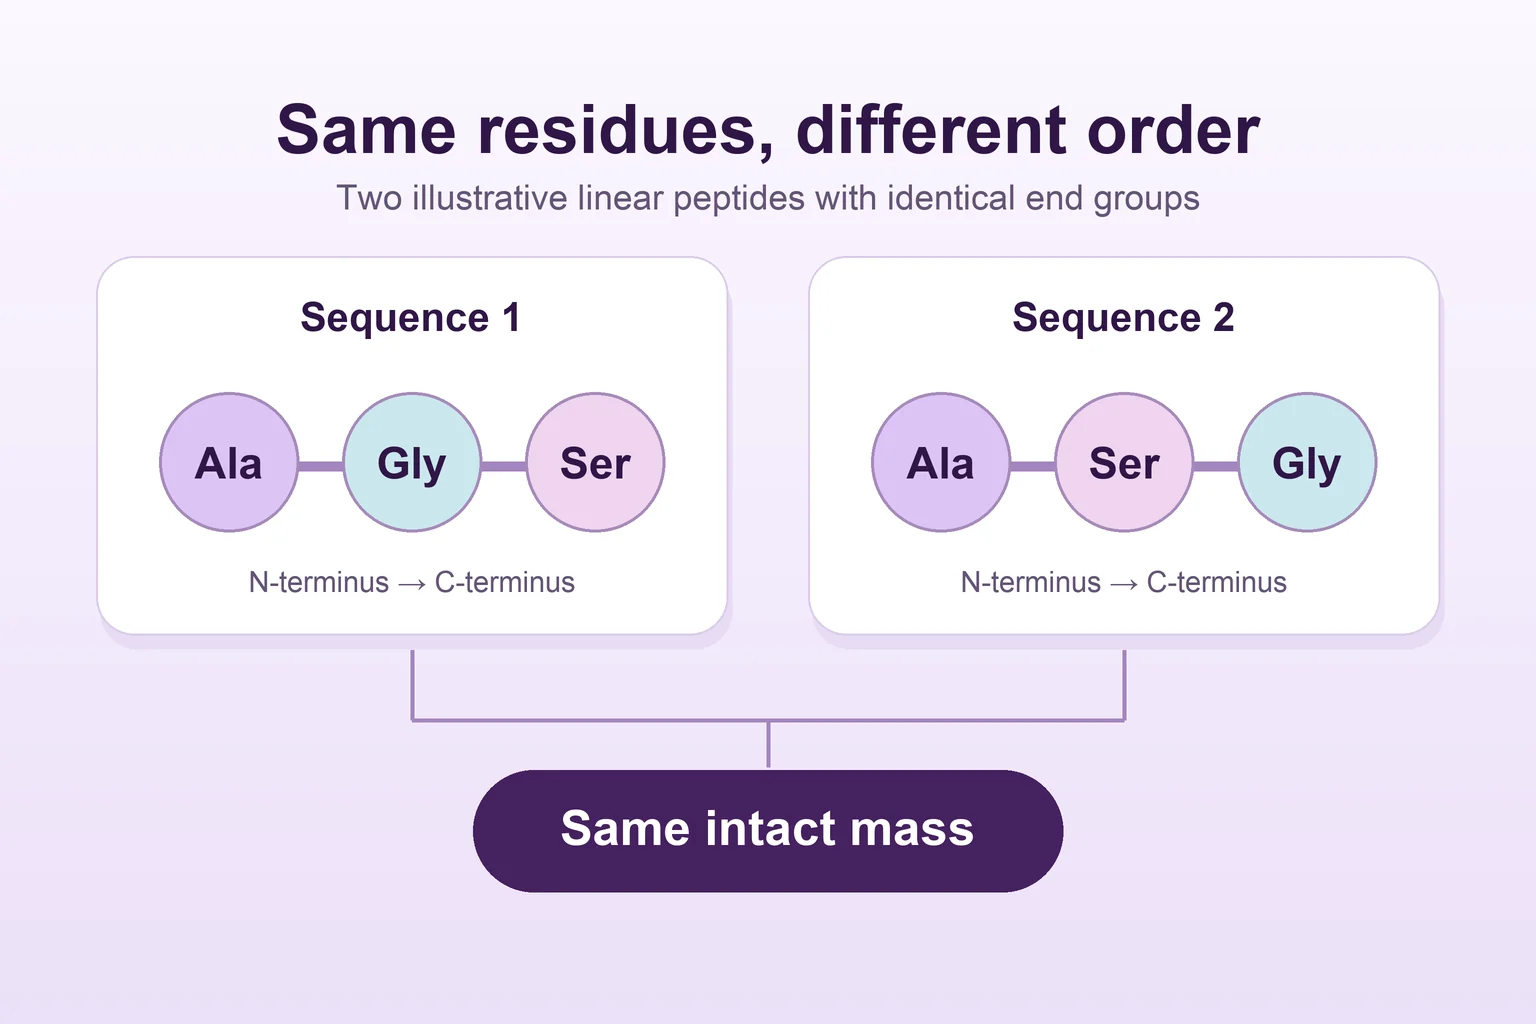
Same mass, different peptide? What a mass spectrum can tell you
Two simple peptide chains can share an intact mass while their amino acids appear in a different order. Follow the evidence needed to tell identity claims apart.
5 min readRead article
EliteGen Research · Blog
Explore published studies, understand the methods, and see what the evidence can tell us.
Follow the RSS feedOriginal articles with links to the research behind them. Each study explainer puts the findings in context: the compound, the experimental model, and the questions that remain.
25 articles
Two simple peptide chains can share an intact mass while their amino acids appear in a different order. Follow the evidence needed to tell identity claims apart.
The well lights up. The curve looks convincing. Before calling it peptide activity, find out whether the experiment also tested what was making the light.
Follow the questions researchers ask after a receptor leaves the cell surface: where does it travel, does it return, and what can its location explain?
Learn to distinguish bacterial growth, surface-attached biomass and viability when reading LL-37 studies, including what conflicting findings leave unresolved.
A binding curve falls. A signaling curve rises. Both can describe the same peptide and receptor. The difference starts with what each experiment can see.
The graph says 70% viability. Did someone count the cells, or did a reader measure light? That difference changes how you read the result.
Two graphs can show the same observations and very different error bars. The caption tells you which question the bars can answer.
The early papers called the receptor GPR54, AXOR12 or hOT7T175. Follow the experiments that brought those names together and gave the receptor a natural ligand.
A small rise in measured glutathione disulfide can move the whole ratio. Blood-sample studies show how researchers traced that change to the sample preparation itself.
Two samples go into the same instrument. One comes back with a much smaller peak. Before blaming degradation, look at what the liquid touched along the way.
One KPV figure follows a tracer. Another follows a change in light. Read them side by side and you can see how researchers built a case for peptide transport.
One curve starts rising sooner. The other reaches higher. Use a worked example and a tirzepatide figure to see what each difference means.
Cells moved farther in one experiment. A receptor signal changed in another. The difference between those measurements is the heart of this BPC-157 research story.
Two binding measurements can move in different directions as a peptide’s design changes. Semaglutide’s discovery and structural studies show why the binding partner matters.
Three receptor curves look easy to compare until you check what each uses as a reference. Follow retatrutide from separate receptor assays to a cultured-cell experiment that measures a different signal.
How much collagen is present and how quickly cells make it are different questions. Two GHK-Cu papers show why the distinction matters in matrix research.
An early SS-31 study compared membranes with and without cardiolipin. Later experiments changed which lipids were in the comparison and sharpened the question about membrane charge.
Follow the MOTS-c evidence from a spot in a cell image to a change in gene expression. Each experiment tells you something different about the peptide.
Two analytical papers followed the seven-residue fragment found in materials called TB-500. Their work shows why a full name, a sequence and a sample ID each matter.
Raun’s ipamorelin paper jumps from pituitary cells to whole-animal experiments. Reading those comparisons separately makes the word “selective” much easier to understand.
An end modification and a set of plasma experiments make tesamorelin a useful case for asking what a peptide stability measurement actually counts.
A receptor disappears from a mouse model. Some observations disappear with it, while others persist. That split is the most interesting part of the AOD-9604 paper.
Follow a peptide from its sequence to a receptor assay, then meet a different kind of experiment where small chains assemble into a visible material.
Tirzepatide can give a strong signal in one assay and a much weaker signal in another. Willard and colleagues’ receptor study explains why both observations matter.
Nine wells could mean nine independent samples or repeated measurements of the same material. Read the legend, the controls and the error bars before deciding what the graph shows.