One molecule, two binding partners
Open two papers on semaglutide and you may find the word binding doing entirely different jobs. In one, the partner is serum albumin. In the other, it is the glucagon-like peptide-1 receptor, or GLP-1R. It is easy to carry the result from one paper into the next and forget to change the name of the protein.
The 2015 discovery paper by Jesper Lau and colleagues is a good place to see why that matters. The team compared an acylated peptide with other designs while tracking its association with albumin and its properties at GLP-1R. Read the comparison with both proteins in view and an apparent contradiction becomes the most interesting part of the paper.
The comparison that makes the design interesting
The authors describe two amino acid substitutions relative to human GLP-1 and a modification at lysine 26. Their design work considered both the fatty acid group and the chemistry linking that group to the peptide. The discovery paper reports higher albumin affinity for semaglutide and lower receptor affinity than liraglutide in its respective comparisons. The authors were affiliated with Novo Nordisk, which developed the compound.
Imagine reading only the receptor number. You would miss the separate change in albumin affinity, and you might tell the story as though the team had made every type of binding stronger. A useful margin note is simply to write the partner's name beside the arrow. If you have two arrows pointing in different directions, the results can coexist because the measurements have different subjects.
The same habit helps when the paper shifts from affinity to a functional readout. Ask whether the experiment estimates an association between molecules or records a response after that interaction. An affinity measurement has its own interpretation even when the compound also produces a response in another assay.
What the albumin crystal actually contains
Stephen Curry and colleagues' albumin structure is an interesting paper to open next. Their 1998 crystal contains human serum albumin and myristate, a fatty acid. The structure places myristate in pockets distributed across the protein. Now look again at the names of the molecules in the sample. The peptide from the 2015 discovery paper is absent from this preparation.
This is a common fork in a literature search. A paper can explain why a design idea is plausible, and a different paper can test the particular compound made with that idea. There is a place for both in a good research summary. Keep the noun from the figure legend when you describe what the structure shows. In this case, myristate is the molecule whose positions were observed. Mapping the contacts made by semaglutide with albumin would be a separate structural question.
The structure includes a receptor and its signalling partner
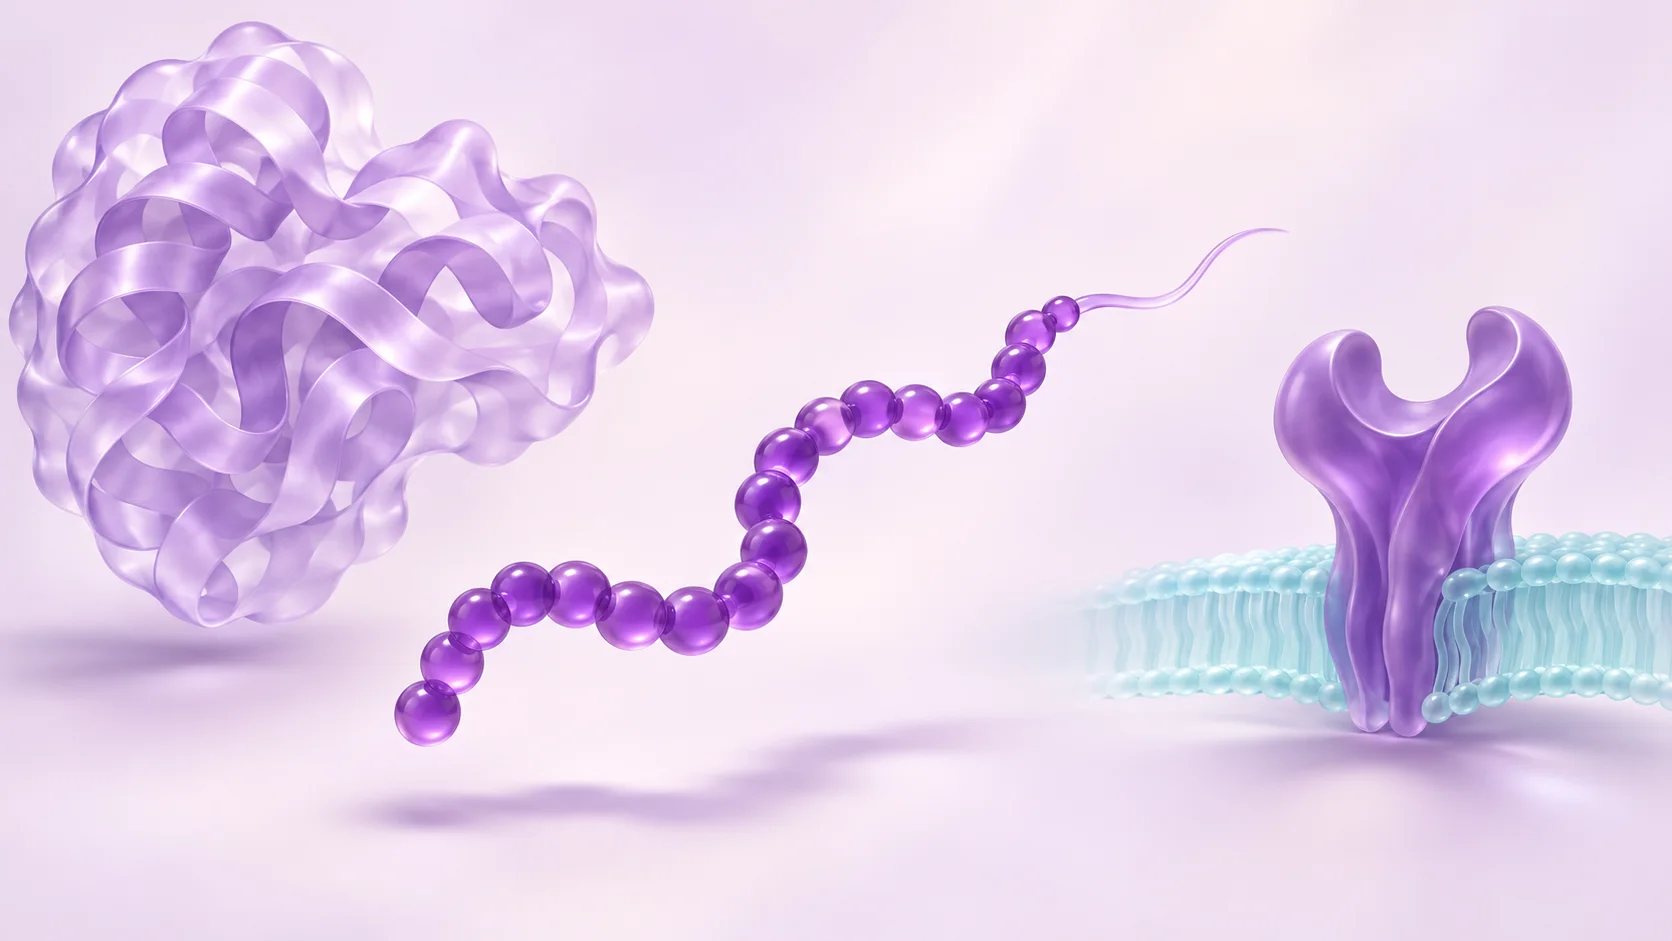
In 2021, Xin Zhang and colleagues examined semaglutide and taspoglutide in prepared complexes with GLP-1R and Gs, a G protein associated with receptor signalling. The researchers used cryo-electron microscopy and examined variation across reconstructed structures. They reported similar ways of engaging the receptor to GLP-1, alongside differences in motion within the peptide–receptor complexes.
Here is a detail worth looking for in the paper. The modified lysine region of semaglutide was unresolved in the overall map. A reconstruction focused on the receptor’s extracellular domain revealed densities the authors interpreted as likely positions of that region. That difference between the two views is part of the result. A clean image of the complex can make every feature look equally certain, so compare the authors’ description of the map with what the drawn model suggests.
A focused reconstruction can help locate a feature. An assay performed separately is the evidence to turn to for its effect on a measured response. The visualisation earns its place by making the next question more precise.
A way to keep the papers straight as you read
Try a short note for each result with three fields: what was in the preparation, what the instrument measured, and what you can carry into your summary. For a figure with a purified complex, start by naming both partners. For a table of affinities, record the comparison compound and the partner before copying the number. For a signalling plot, add the cellular readout and the time point.
Suppose your notes say the modified candidate has stronger binding in comparison A and produces a smaller signal in comparison B. Those are two observations. If the next sentence claims that the stronger binding caused the smaller signal, it needs another piece of evidence. Circle that causal connection and turn it into a question the paper would have to address. This example is an exercise in reading a result, with no numbers from either study.
Carry the material name through to the conclusion
A paper can be exact about the material it tested and leave plenty to learn about a sample from somewhere else. When you move from literature to lab records, keep the source of each piece of information visible. The article tells you what was studied. A lot-specific analytical record describes the sample identified on that document. That distinction becomes especially useful when names, sequence modifications and assay conditions are scattered across several references.
Frequently asked questions
Is albumin affinity the same measurement as GLP-1 receptor affinity?
They describe association with different proteins. The discovery paper tracks both properties and reports them separately against liraglutide. Preserve the protein’s name when making a comparison or an affinity number can lose its meaning.
Which molecules are present in the albumin structure discussed here?
The Curry study resolved a complex of human serum albumin and myristate. Its value here is to show an actual example of how a fatty acid sits in albumin. Use the discovery paper for the compound-specific affinity comparison.
Sources: Curry and colleagues, Nature Structural Biology (1998): Crystal structure of human serum albumin complexed with fatty acid reveals an asymmetric distribution of binding sites · Lau and colleagues, Journal of Medicinal Chemistry (2015): Discovery of the Once-Weekly Glucagon-Like Peptide-1 (GLP-1) Analogue Semaglutide
What does Gs mean in a GLP-1R–Gs structure?
Gs is the G protein included with the receptor in that prepared complex. The structure describes the receptor in that particular molecular setting. A cell signalling experiment asks what changes in the measured output when the receptor is engaged.
What should I record when comparing a new analogue with the discovery paper?
Start with the identity of each analogue, then note the partner, reference compound and type of measurement. A structure, affinity estimate and cellular response each belong in their own row. That gives you a comparison you can revisit without having to reconstruct what each number meant.
Sources
- Discovery of the Once-Weekly Glucagon-Like Peptide-1 (GLP-1) Analogue SemaglutideLau and colleagues, Journal of Medicinal Chemistry · 2015 · DOI: 10.1021/acs.jmedchem.5b00726
- Crystal structure of human serum albumin complexed with fatty acid reveals an asymmetric distribution of binding sitesCurry and colleagues, Nature Structural Biology · 1998 · DOI: 10.1038/1869
- Structure and dynamics of semaglutide- and taspoglutide-bound GLP-1R-Gs complexesZhang and colleagues, Cell Reports · 2021 · DOI: 10.1016/j.celrep.2021.109374
Published by EliteGen Research for research education. Studies describe their own materials and experimental conditions; they do not establish the identity, quality, or suitability of an EliteGen product. This article does not provide guidance for personal, human, or veterinary use.