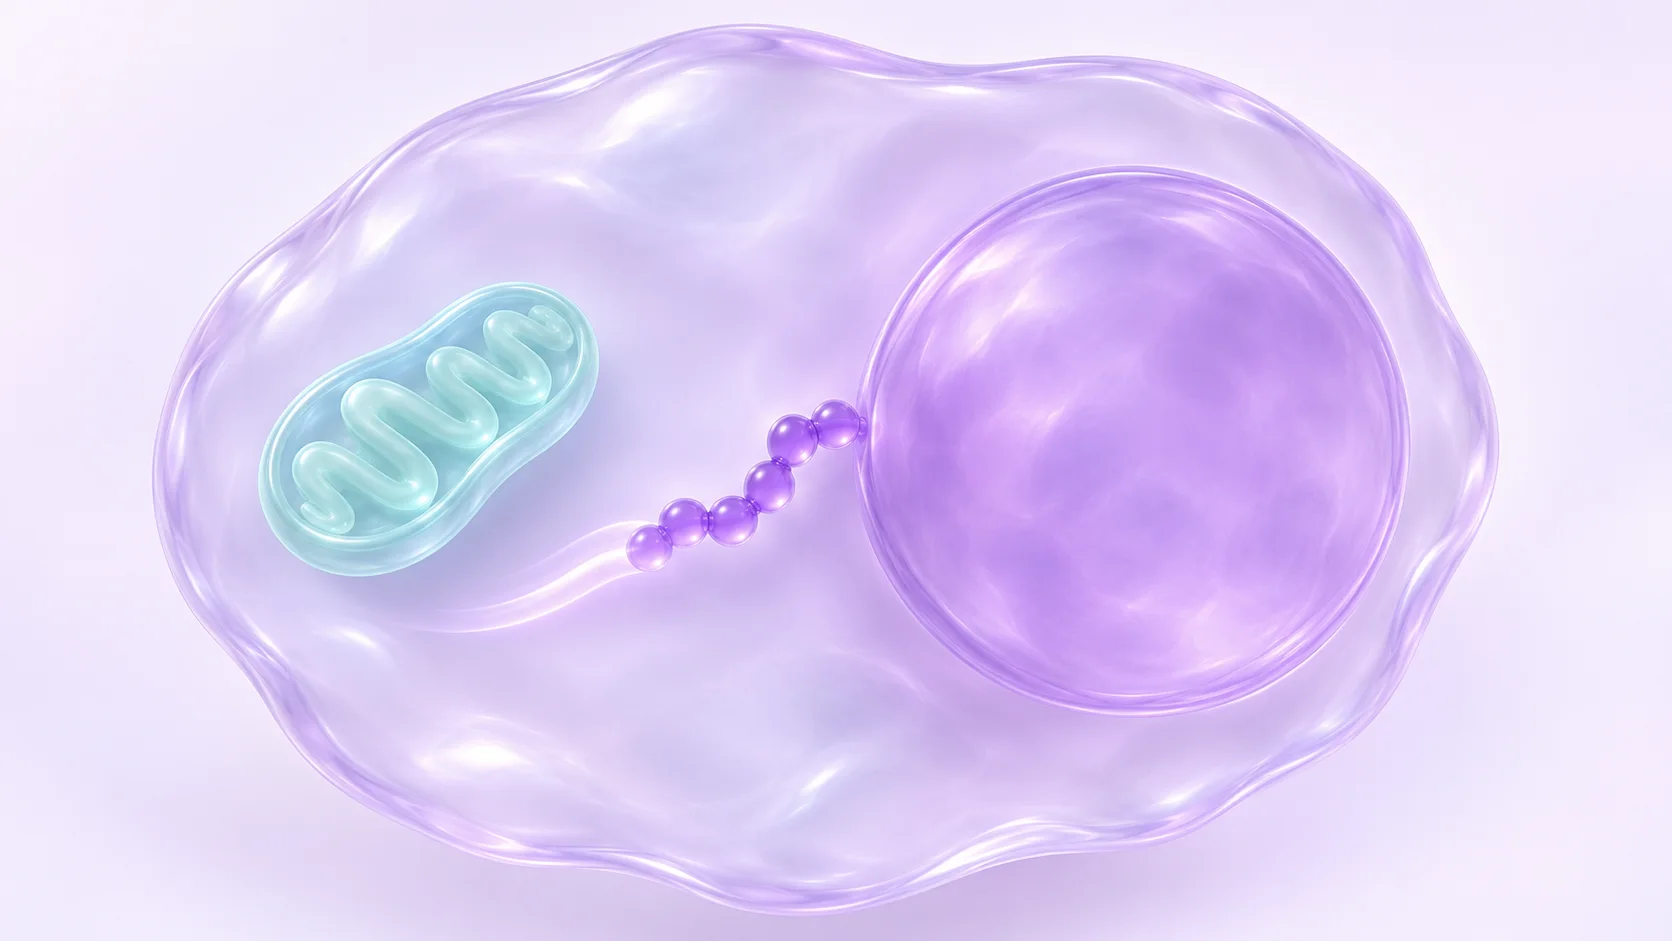
A coding sequence inside a mitochondrial gene
A fluorescent spot appears inside the outline of a nucleus. There is a lot to learn from that small patch of colour. Before it can explain anything about gene expression, a reader needs to know what produced the signal, where the boundaries were drawn and what changed in the comparison. That is the detective work at the heart of MOTS-c research.
Lee and colleagues introduced MOTS-c in 2015 as a 16-residue peptide whose coding sequence lies within the mitochondrial 12S ribosomal RNA region. There are two addresses to keep track of here. The first belongs to the coding sequence. The second belongs to the peptide signal that an experiment measures. A change in the second address leaves the first one right where it was.
Two ways to change what a cultured cell encounters
The 2015 paper used HEK293 cells to compare patterns of RNA and small molecules involved in metabolism. Some experiments used cells made to express MOTS-c. Others exposed cells to a synthetic preparation. The researchers reported some overlap in the metabolic patterns from the two approaches. The paper also investigated changes in AMPK signalling and included a separate set of mouse experiments.
If you are comparing figures, put the intervention beside the name of the cell line. The labels “expression” and “external addition” tell you how each experiment began. They leave room for a question that a familiar cell line can make easy to miss. Which parts of the response appear across both conditions, and which appear only when the experiment starts in a particular way? An overlap can justify following a lead without resolving how the peptide reached any particular compartment.
A cell image and a separated fraction answer different parts of the location question
Kim and colleagues reported greater nuclear MOTS-c signal under metabolic stress in cultured cells. Their 2018 paper used microscopy and immunoblots of separated cell fractions, mainly in HEK293 cells, with related observations in HepG2 cells. They also tested how changing AMPK activity affected the nuclear signal.
The image lets you look at the relationship between the signal and the marked outline of the nucleus. The fraction comparison gives you a separate read on which cellular material carries the signal. Read the controls with each panel. For an image, the labels tell you what was marked and how to find it. For separated fractions, compartment markers help establish what each sample contains. Agreement between approaches is easier to interpret when the two signals have different potential sources of error.
In Figure 1, find the panel that compares separated compartments, then look at the microscopy panel with the nucleus marked. Those establish where the signal can be detected. Figure 3 asks a different question by changing AMPK activity and measuring the nuclear signal under stress.
What changed once the signal was found?
The location study also examined chromatin, interactions involving the transcription factor NRF2 and gene expression measured with RNA sequencing. These results gave the team ways to investigate what the peptide might do after a change in distribution. The paper identifies work in primary cells and tissues as a way to learn how far the observations extend.
Take a moment with the verbs in a figure legend. “Detected,” “associated” and “changed” describe different kinds of evidence. Picture two hypothetical panels. One shows a signal in the nuclear fraction. The other shows that RNA for a particular gene went up. Both may be good observations. The reader still needs an experiment that tests whether changing localization changes that particular RNA result. Keeping that link visible makes it easier to see exactly where a mechanistic explanation is still taking shape.
What a mouse plasma sample can add
In a separate 2019 study, Su-Jeong Kim and colleagues used mass spectrometry to compare plasma metabolites between groups of mice maintained on a high-fat diet. The profiles differed. Over the short study, the team reported no detected difference in body-weight change or food intake.
The useful word in this part of the story is “plasma.” The measurement comes from a circulating sample. A metabolite’s abundance there has several possible explanations, including changes in production, breakdown or movement between compartments. A profile can point to questions about pathways while leaving the tissue and cellular steps to be measured. That makes this study useful alongside the cell work, even though its figures cannot tell you whether a peptide signal moved into a nucleus.
Three short notes beside each figure
Try writing down where the sample came from, what the instrument counted and which two conditions were compared. A useful entry might read “nuclear fraction, peptide-associated signal, stressed cells versus control cells.” A neighbouring entry might read “whole-cell RNA, transcripts, two experimental conditions.” The exercise makes it harder to mix up the subject of the measurement with the explanation for it.
When a paper moves from a molecular location to a change in expression, mark the experiment that links the two. When it moves to an animal model, start a fresh note with the tissue or fluid actually collected. These are comparisons among published preparations and models. Identifying or characterising a separate research lot takes its own analytical evidence.
Study disclosures
Changhan Lee disclosed consulting for CohBar and holding shares in the company in the 2018 paper. Pinchas Cohen disclosed consulting and share ownership with CohBar in the 2019 study. Both statements appear in the original publications.
Sources: Kim and colleagues, Cell Metabolism (2018): The Mitochondrial-Encoded Peptide MOTS-c Translocates to the Nucleus to Regulate Nuclear Gene Expression in Response to Metabolic Stress · Kim and colleagues, Physiological Reports (2019): The mitochondrial-derived peptide MOTS-c is a regulator of plasma metabolites and enhances insulin sensitivity
Frequently asked questions
Why did the researchers use both microscopy and cell fractions?
Microscopy retains the cell’s layout, so the reader can see where a signal falls relative to a marked structure. Fractionation provides a second line of evidence by allowing the researchers to compare signals in samples from different compartments. Each readout has its own controls.
What does AMPK dependence describe in the 2018 paper?
The researchers tested whether the stress-associated rise in nuclear MOTS-c signal depended on AMPK in their cell system. That result answers a specific question about localization. The link to an individual gene still has to be evaluated with the relevant expression and mechanistic evidence.
Does a plasma metabolite profile tell us which tissue caused the change?
A profile records what was measured in the sampled plasma. Assigning the change to a tissue takes additional measurements that trace its origin. That is why the mouse plasma study and the cultured-cell localization study belong on separate lines in a literature review.
Sources
- The mitochondrial-derived peptide MOTS-c promotes metabolic homeostasis and reduces obesity and insulin resistanceLee and colleagues, Cell Metabolism · 2015 · DOI: 10.1016/j.cmet.2015.02.009
- The Mitochondrial-Encoded Peptide MOTS-c Translocates to the Nucleus to Regulate Nuclear Gene Expression in Response to Metabolic StressKim and colleagues, Cell Metabolism · 2018 · DOI: 10.1016/j.cmet.2018.06.008
- The mitochondrial-derived peptide MOTS-c is a regulator of plasma metabolites and enhances insulin sensitivityKim and colleagues, Physiological Reports · 2019 · DOI: 10.14814/phy2.14171
Published by EliteGen Research for research education. Studies describe their own materials and experimental conditions; they do not establish the identity, quality, or suitability of an EliteGen product. This article does not provide guidance for personal, human, or veterinary use.